Blog
Benchmarking Cartographer
Mar 24, 2022
Benchmarking Cartographer
The Cartographer team has recently investigated resource consumption. The goal: to quantify CPU and memory consumption to enable making better informed resource configuration recommendations.
This article shares the approach, details of the initial implementation, results, and some final thoughts as well. The implementation itself is fairly rudimentary but the problems and solutions outlined here may apply broadly.
High level approach
The high level plan is as follows:
- Deploy a Cartographer release to be measured on a cluster;
- Restart the pod;
- Execute a run of a test plan with a given scale;
- Sample and record memory and CPU consumption;
- Repeat (2-4) with a different scale;
- Plot some graphs and see results.
Currently, steps 2-5 are automated. This can be seen in the file ./hack/benchmark.sh . Restarting the pod is necessary to avoid results clouded by caching or uncollected garbage.
Identifying the relevant scales and exercising the test plan (steps 3 & 5) are very dependent on the behavior of the controller, and so will be explained last.
The more generic and broadly applicable aspects: deployment, sampling and recording consumption, are covered first.
Deployment
The release to be measured is manually deployed. When the benchmark script is running, it deletes the controller pod between test plan runs, and relies on the Deployment to restart it.
An easily reproducible cluster is used, in this case, a GKE cluster running on 3 e2-standard-4 nodes.
Sampling and recording memory consumption
Sampling of CPU and memory consumption is via the the
metrics api.
This provides an endpoint which can be used to retrieve metrics on pods and nodes. You can also query it via
kubectl top:
kubectl top pod -n cartographer-system
Since each run involves restarting the pod, it can take a while for the metrics to appear. Polling with the above snippet first to ensure metrics are available before executing the test plan addresses this.
Access to this API (as well as the accumulation of samples during a run) is encapsulated in a simple abstraction,
[PodMetricsSampler].
type PodMetricsSampler interface {
	Reset()
	SampleConsumption(label string) error
	MaxCPU() *resource.Quantity
	MaxMem() *resource.Quantity
	MinCPU() *resource.Quantity
	MinMem() *resource.Quantity
}
While the test plan runs, it’s SampleConsumption() function is periodically invoked to record the current CPU and
memory metrics for the controller Pod. At the end of a test plan run, the maximum and minimum values can be obtained.
With deployment, the metrics server, and this little utility, we have all the machinery needed to make measurements, all we need is the test plan.
Test plan
In order to capture measurements that account for typical processing by the controller, it must be exercised with input that triggers this processing.
To make it measure it at different scales, this input size needs to also be configurable.
Creating the Cartographer plan begins with considering resources reconciled by the controller: Blueprints (SupplyChains and Deliveries), their owners (Workloads and Deliverables, respectively) and Runnables. (See: Cartographer Architecture)
Due to commonalities, we elect one of the Blueprint and owner pairs: SupplyChain and Workload. Runnables have a considerably different reconciliation behavior, so we include this in the test plan as well.
SupplyChains and Workloads
Digging deeper on SupplyChains and Workloads, we consider the controller’s activity on these objects. SupplyChains define a number of resources that are expected exist for a given Workload. Cartographer reconciles this by creating or updating the desired resources. The content of desired resources is a result of evaluating templates defined in the SupplyChain resource.
So, if we have the following variables:
sthe number of SupplyChainscthe number of resource components in a SupplyChainwthe number of Workloads
Ultimately, to reconcile all workloads, Cartographer will evaluate and create s * c * w resources. Anticipated usage
patterns are for low values of s and c but potentially large values of w, so the plan uses a small set of trivial
SupplyChains with a single component, but allows for arbitrary large w. Checking the Workload reconciliation simply
requires ensuring all Workloads achieve the Ready == True condition, and the expected resources exist.
Runnables
Runnable is trickier: it declares a resource to be created whenever its inputs change. This input change stimuli is absent in a test, so it is necessary to simulate them so that we can discover what happens as they scale. For a catchier name, we call this number Runnable Runs.
We expect that the number of input changes over time will be large. To keep this in check, Cartographer has a mechanism to cull older resources which are no longer relevant. We will look for evidence of this in the results.
The processing for such resources created by Runnable also presents a testing problem. Such resources have a notion of achieving success (surfaced in their Status), which is used to signal when Cartographer can extract output from them. We have the test also simulate the status transition to Success.
Given all of the above, for a given number of Runnables, r and Runnable Runs, n, our test plan:
- ensures the created resource exists;
- simulates success by updating the resource status;
- ensures the runnable is processed and surfaces the successful output;
- trigger another run until
nruns of this runnable is complete.
Test plan implementation
The test plan described above is implemented with Ginkgo and can be found here . Environment variables control the scale:
CARTO_BENCH_N_SUPPLY_CHAINS   number of supply chain objects to create  (s, c=1)
CARTO_BENCH_N_WORKLOADS       number of workload objects to create      (w)
CARTO_BENCH_N_RUNNABLES       number of runnable objects to create      (r)
CARTO_BENCH_N_RUNNABLE_RUNS   number of times to simulate a change triggering another run on each runnable (n)
Results, Interpretation, future directions
Here’s a rundown of the different datasets (there’s a separate tab for each one in the google sheet), with a quick explanation of their test plan configuration, what we know from the results, and where they may lead the team next…
Runnable runs consumption
This dataset focuses on ensuring Runnable Runs memory consumption is bounded, so it does not create Workloads. Since we
expect runs to be culled by Cartographer, a relatively low value for n above the culling threshold can be used.
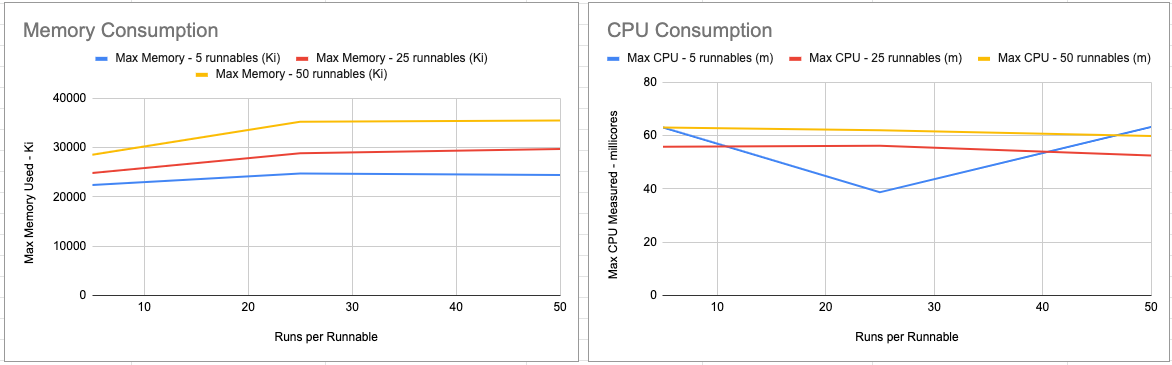
The memory graph demonstrates memory consumption plateaus as expected.
The CPU graph seems to indicate mostly flat usage. It’s not clear if the controller is working hard enough, either because the scale is not sufficiently large or because of the overhead of Runnable Run simulation.
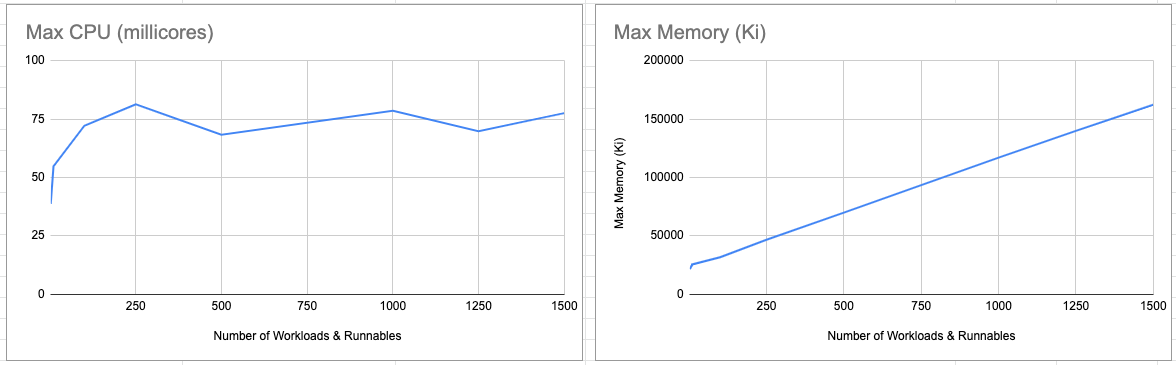
Overall resource consumption @3 runs/runnable
The aim of this dataset is to create increasing numbers of Workloads and Runnables with two goals:
- keeping the controller constantly working to find high watermark in CPU usage
- identifying memory consumption trend as scale increases
A token value of n = 3 is selected, both for expediency and the fact that we test for higher values of n in the
Runnable runs consumption dataset.
The memory graph demonstrates that memory consumption has a linear, unbounded relationship to the number of Workloads and Runnables. By current design, Cartographer has a non-expiring cache of these kinds of objects. This means planning resource allocations would require reasoning about Workload and Runnable capacity to avoid out-of-memory situations, or simply providing more than sufficient headroom for now, until this design is changed.
The CPU graph demonstrates a mostly upward trend. We hypothesize that the dip at w = r = 50 may be due to bottlenecks
in simulating transitions and retriggers of Runnable Runs. Cartographer does not process many resources concurrently, so
there is an expectation that CPU consumption should be bounded. As such, the unbounded trend on the graph suggests the
upper bounds on w = r = 250 is not large enough.
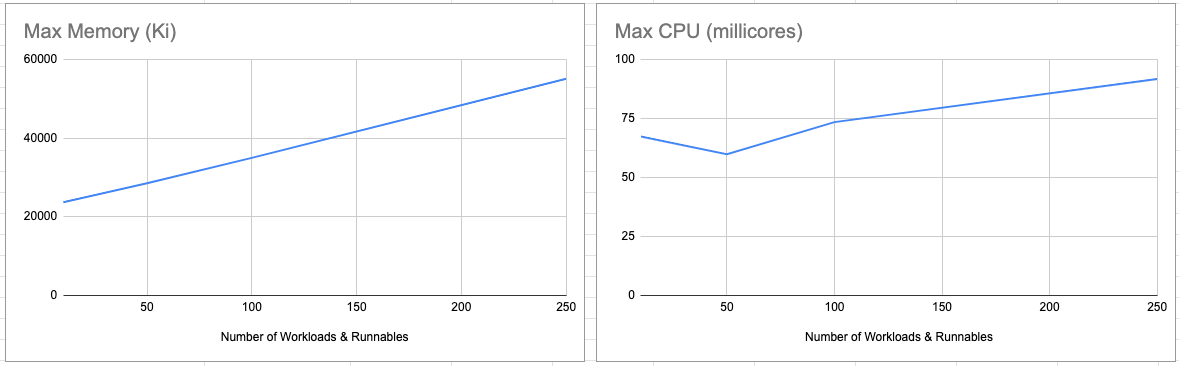
Overall resource consumption @1 run/runnable
The aim of this dataset is driven by the hypothesis that simulating runnable runs may introduce bottlenecks that prevent
discovering a ceiling in the controller’s CPU consumption, so now, n = 1. Because this can run significantly faster,
we can exercise greater scale on other inputs, as seen with the upper limit on w = r = 1500.
The memory graph is unsurprisingly similar to Overall resource consumption @3 runs/runnable, and for the same reasons.
The CPU graph demonstrates usage is bounded at around 81 millicores. We’re currently working on a hypothesis on the
fluctuation between w = r = 250 and w = r = 1500, but it may be in part due to the point-in-time sampling of the CPU
which fluctuates constantly compared to the memory measurements which are taken from the process heap size which does
not typically contract.
Final thoughts
CPU consumption is bound at 91 millicores; This maximum sample was recorded from the dataset Overall resource consumption @3 runs/runnable. This is 12% higher than the maximum recorded in any other dataset, so further investigation may still be required. This seems plausible since the controller isn’t highly concurrent - and that becomes evident when running some of these tests: Reconciling 1500 workloads, 1500 runnables with 1 run each takes nearly 3 hours to run.
Memory consumption grows linearly. Whilst the consumption of Runnable Runs is bounded, this upper bound is directly tied to configuration of each Runnable’s retentionPolicy.
Consumption per Workload and Runnables grows linearly, but is unbounded. This confounds attempts to determine meaningful memory limits because safe configuration requires providing ample headroom to account for all Cartographer resources. It will be hard to reason about the size of these resources in reality, as templates and blueprints may have varying sizes.
The bounds of the benchmark are limited in scope, but can always be expanded. They do not measure the impact of different sized templates and blueprints which could account for increased CPU and Memory usage, for example.
If you’re curious, you can take a look at the measurements for release 0.3.0-build3 .